Step 5
Data Collection, Processing, Visualisation

Now that you have implemented your sensing project it's time to collect the data you need to inform better policy, interventions, and designs to improve your public space. Understanding different types of data sensors can generate and how it is used to achieve your goals in responsible and ethical ways will be the focus of this section.

Questions
Data can be a powerful tool to improve public spaces or it can be an invasive threat to our personal privacy. Take time to think about how and why you create, use, and visualise data in your project. Among several considerations you should first ask yourself:
First and foremost, is your project GDPR compliant?
Are you doing this with the public in mind and in ways the data will be useful?
Where can you test your sensors and train your data sets in a controlled environment?

Resources
There are many types of sensors and ways to collect data. In this section we’ll be providing some examples of hardware, data collection, data storage, data processing, data visualisation and most importantly, how to share data. Specifically:
Types of Sensors
Degrees of Invasiveness
Data Architecture
Data Visualisation

Video Library
Visit the video library for an expert interview and advice about defining use cases and goals.
In this section we’ll be speaking with expert:
Markus Pfundstein – Founder and Principle Engineer Life Electronic
5.1 Questions
In Step 3 we provided vital information about data and GDPR compliance as well as data ethics in relation to crowd monitoring in public spaces. This section is about the data itself – how it is generated, the levels of invasiveness, examples of data architecture, and the value you can generate with visualizations and dashboards. Among some considerations in this section you should think about:
- How invasive is the technology you are using and do you really need to use this technology?
- How can you create a baseline so you can measure the changes you are hoping to make?
- Are you gathering only the data you need to solve your problem or more than you need? If so, why?
- How can you minimize the amount of data you are collecting in public space?
- Can you implement a crowd monitoring test, project, or solution that is transparent and inclusive rather than exclusively imposing surveillance?
- Are the right security measures being taken to protect the data from unauthorized access?
- Is your organisation authorised to act on the data generated data?
5.2 Generating Data in Public Space
The choice of devices and sensors to use is important, especially in public space. There are many different makes and models to choose from. Each of these devices can capture, store, process, and publish data. The devices you decide to use and the data they produce should be proportional to their invasiveness. Below you will find a list of various technologies and types of data they can collect.
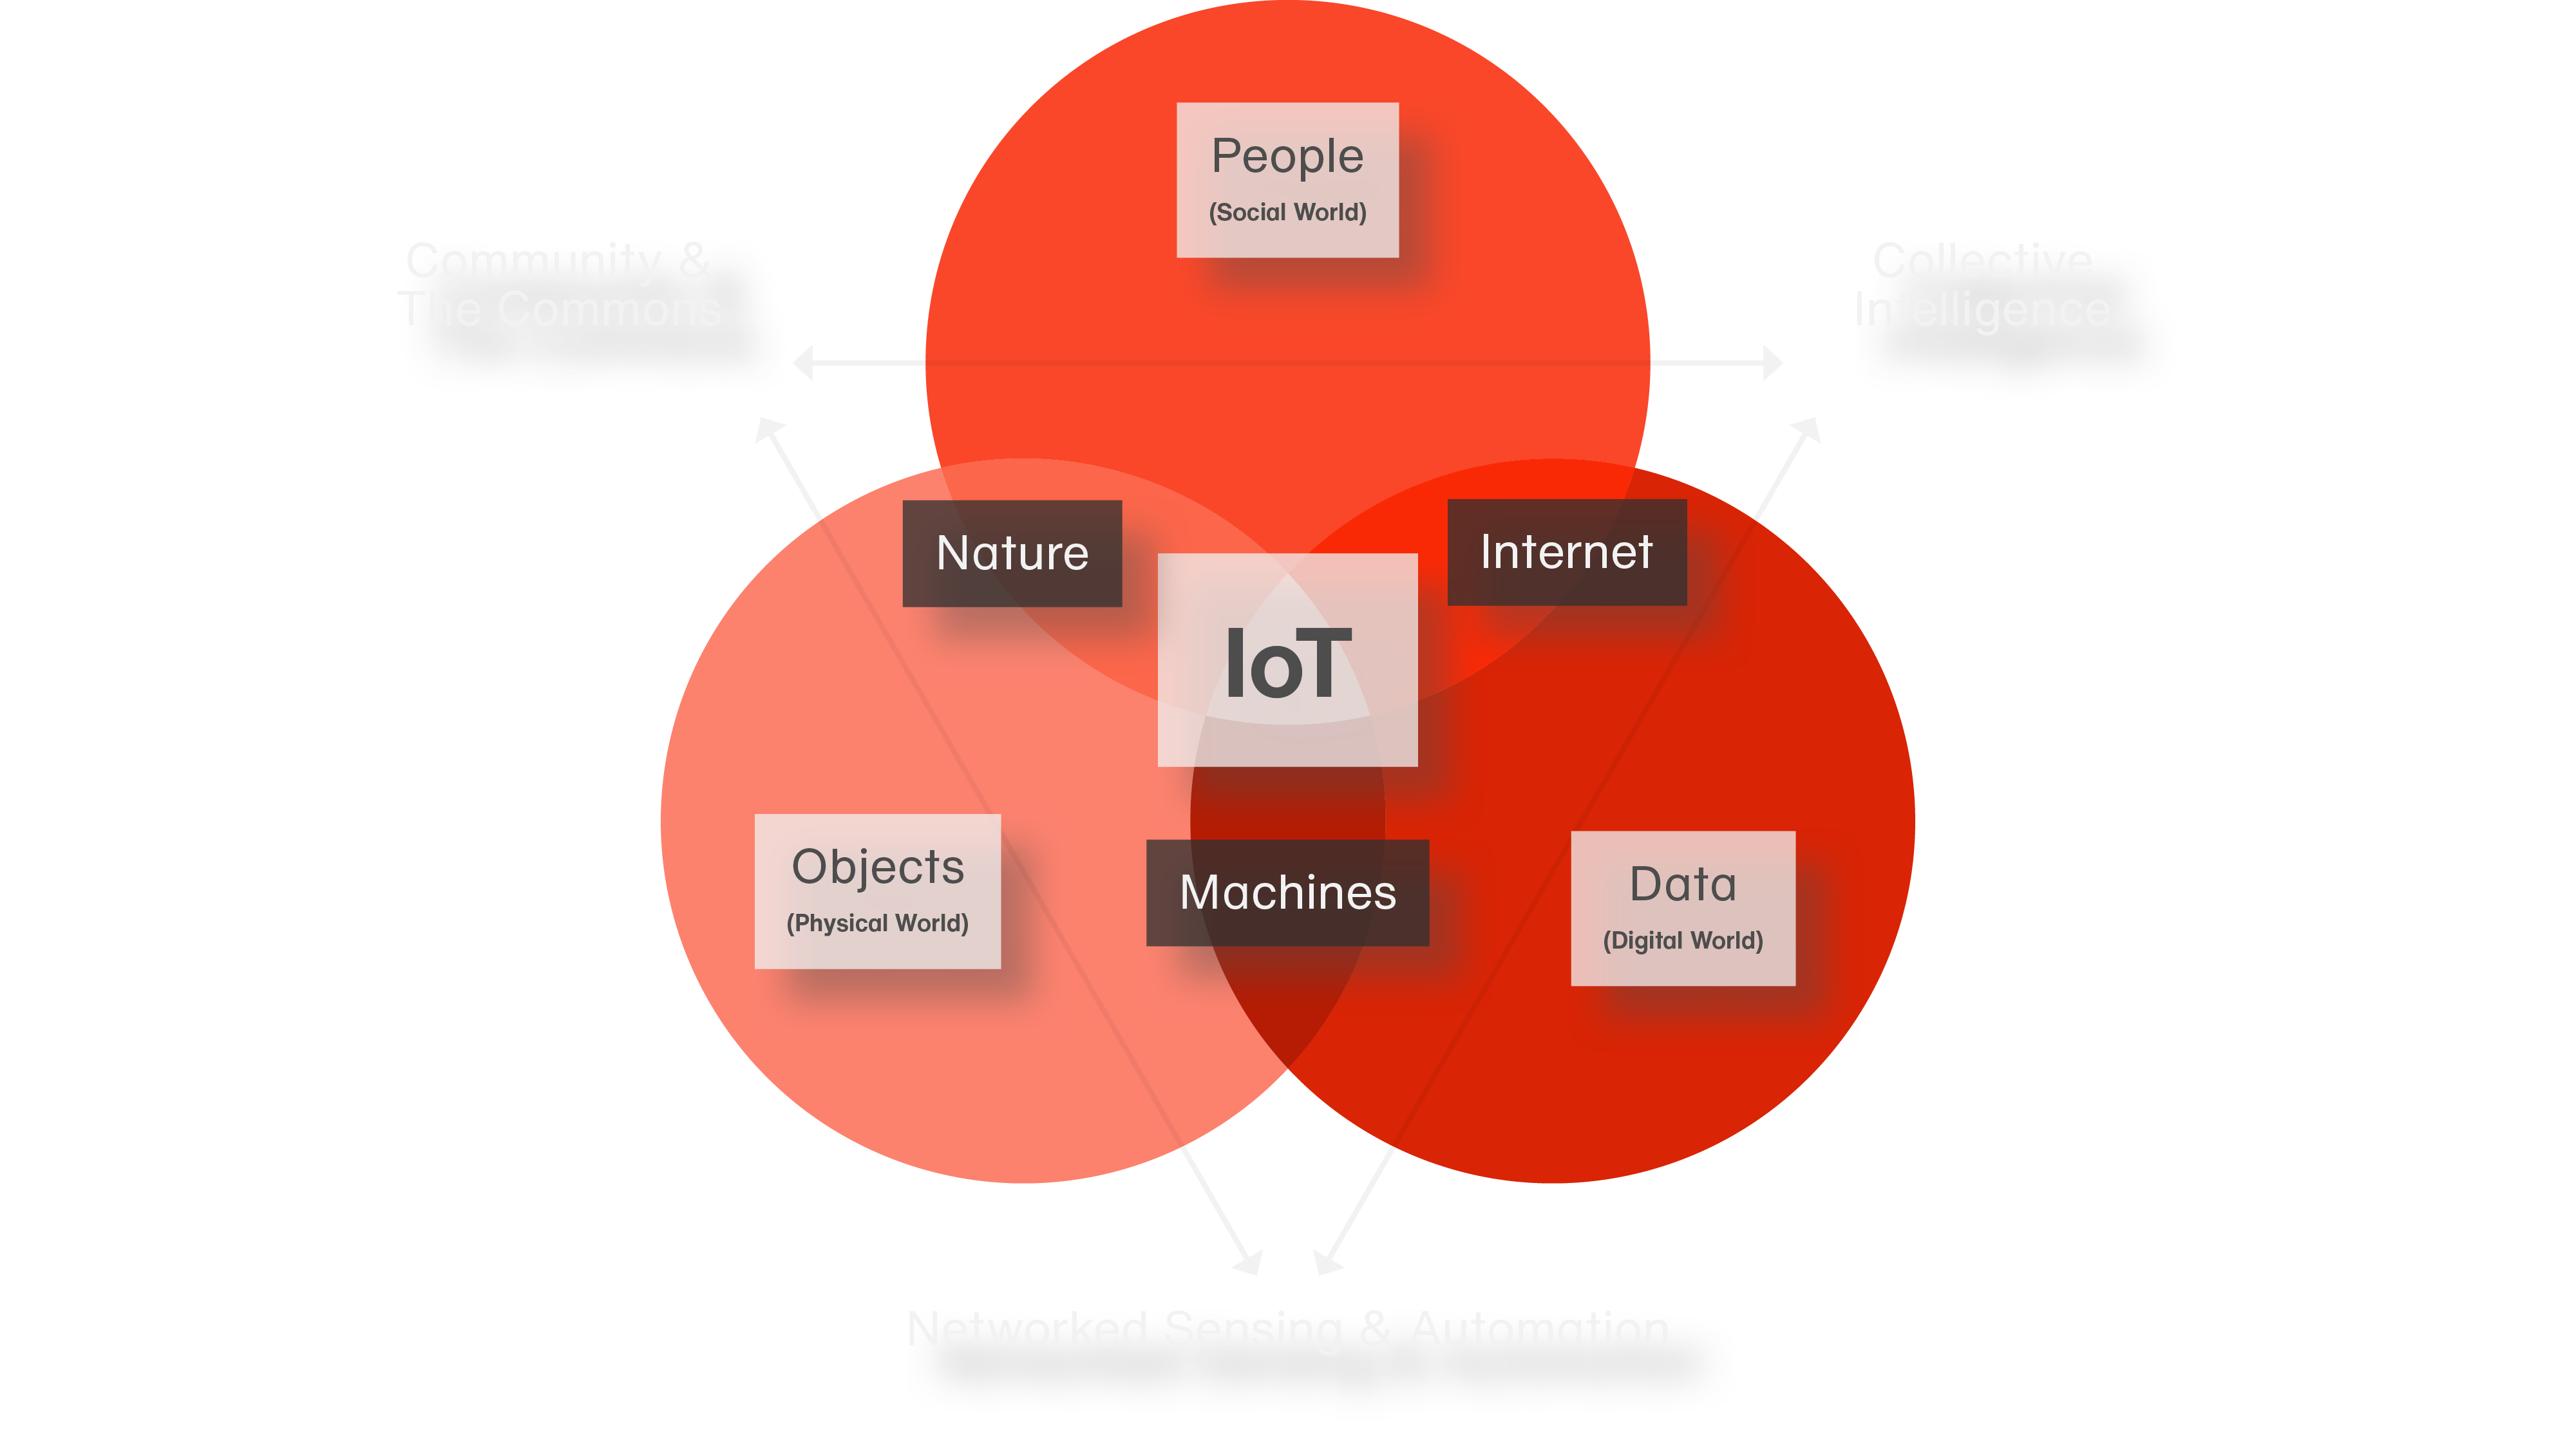
IoT Interactive Environments
The Internet of Things (IoT) is a sort of catch all term used when objects interact with the internet. For the Responsible Sensing Toolkit we think of IoT Environments where sensors are used in public spaces to create data about the physical word and the people in them. The complex relationship between people, data, and objects and how IoT can generate data for common good in our cities is illustrated below in the IoT Interaction Ecosystem Venn diagram.
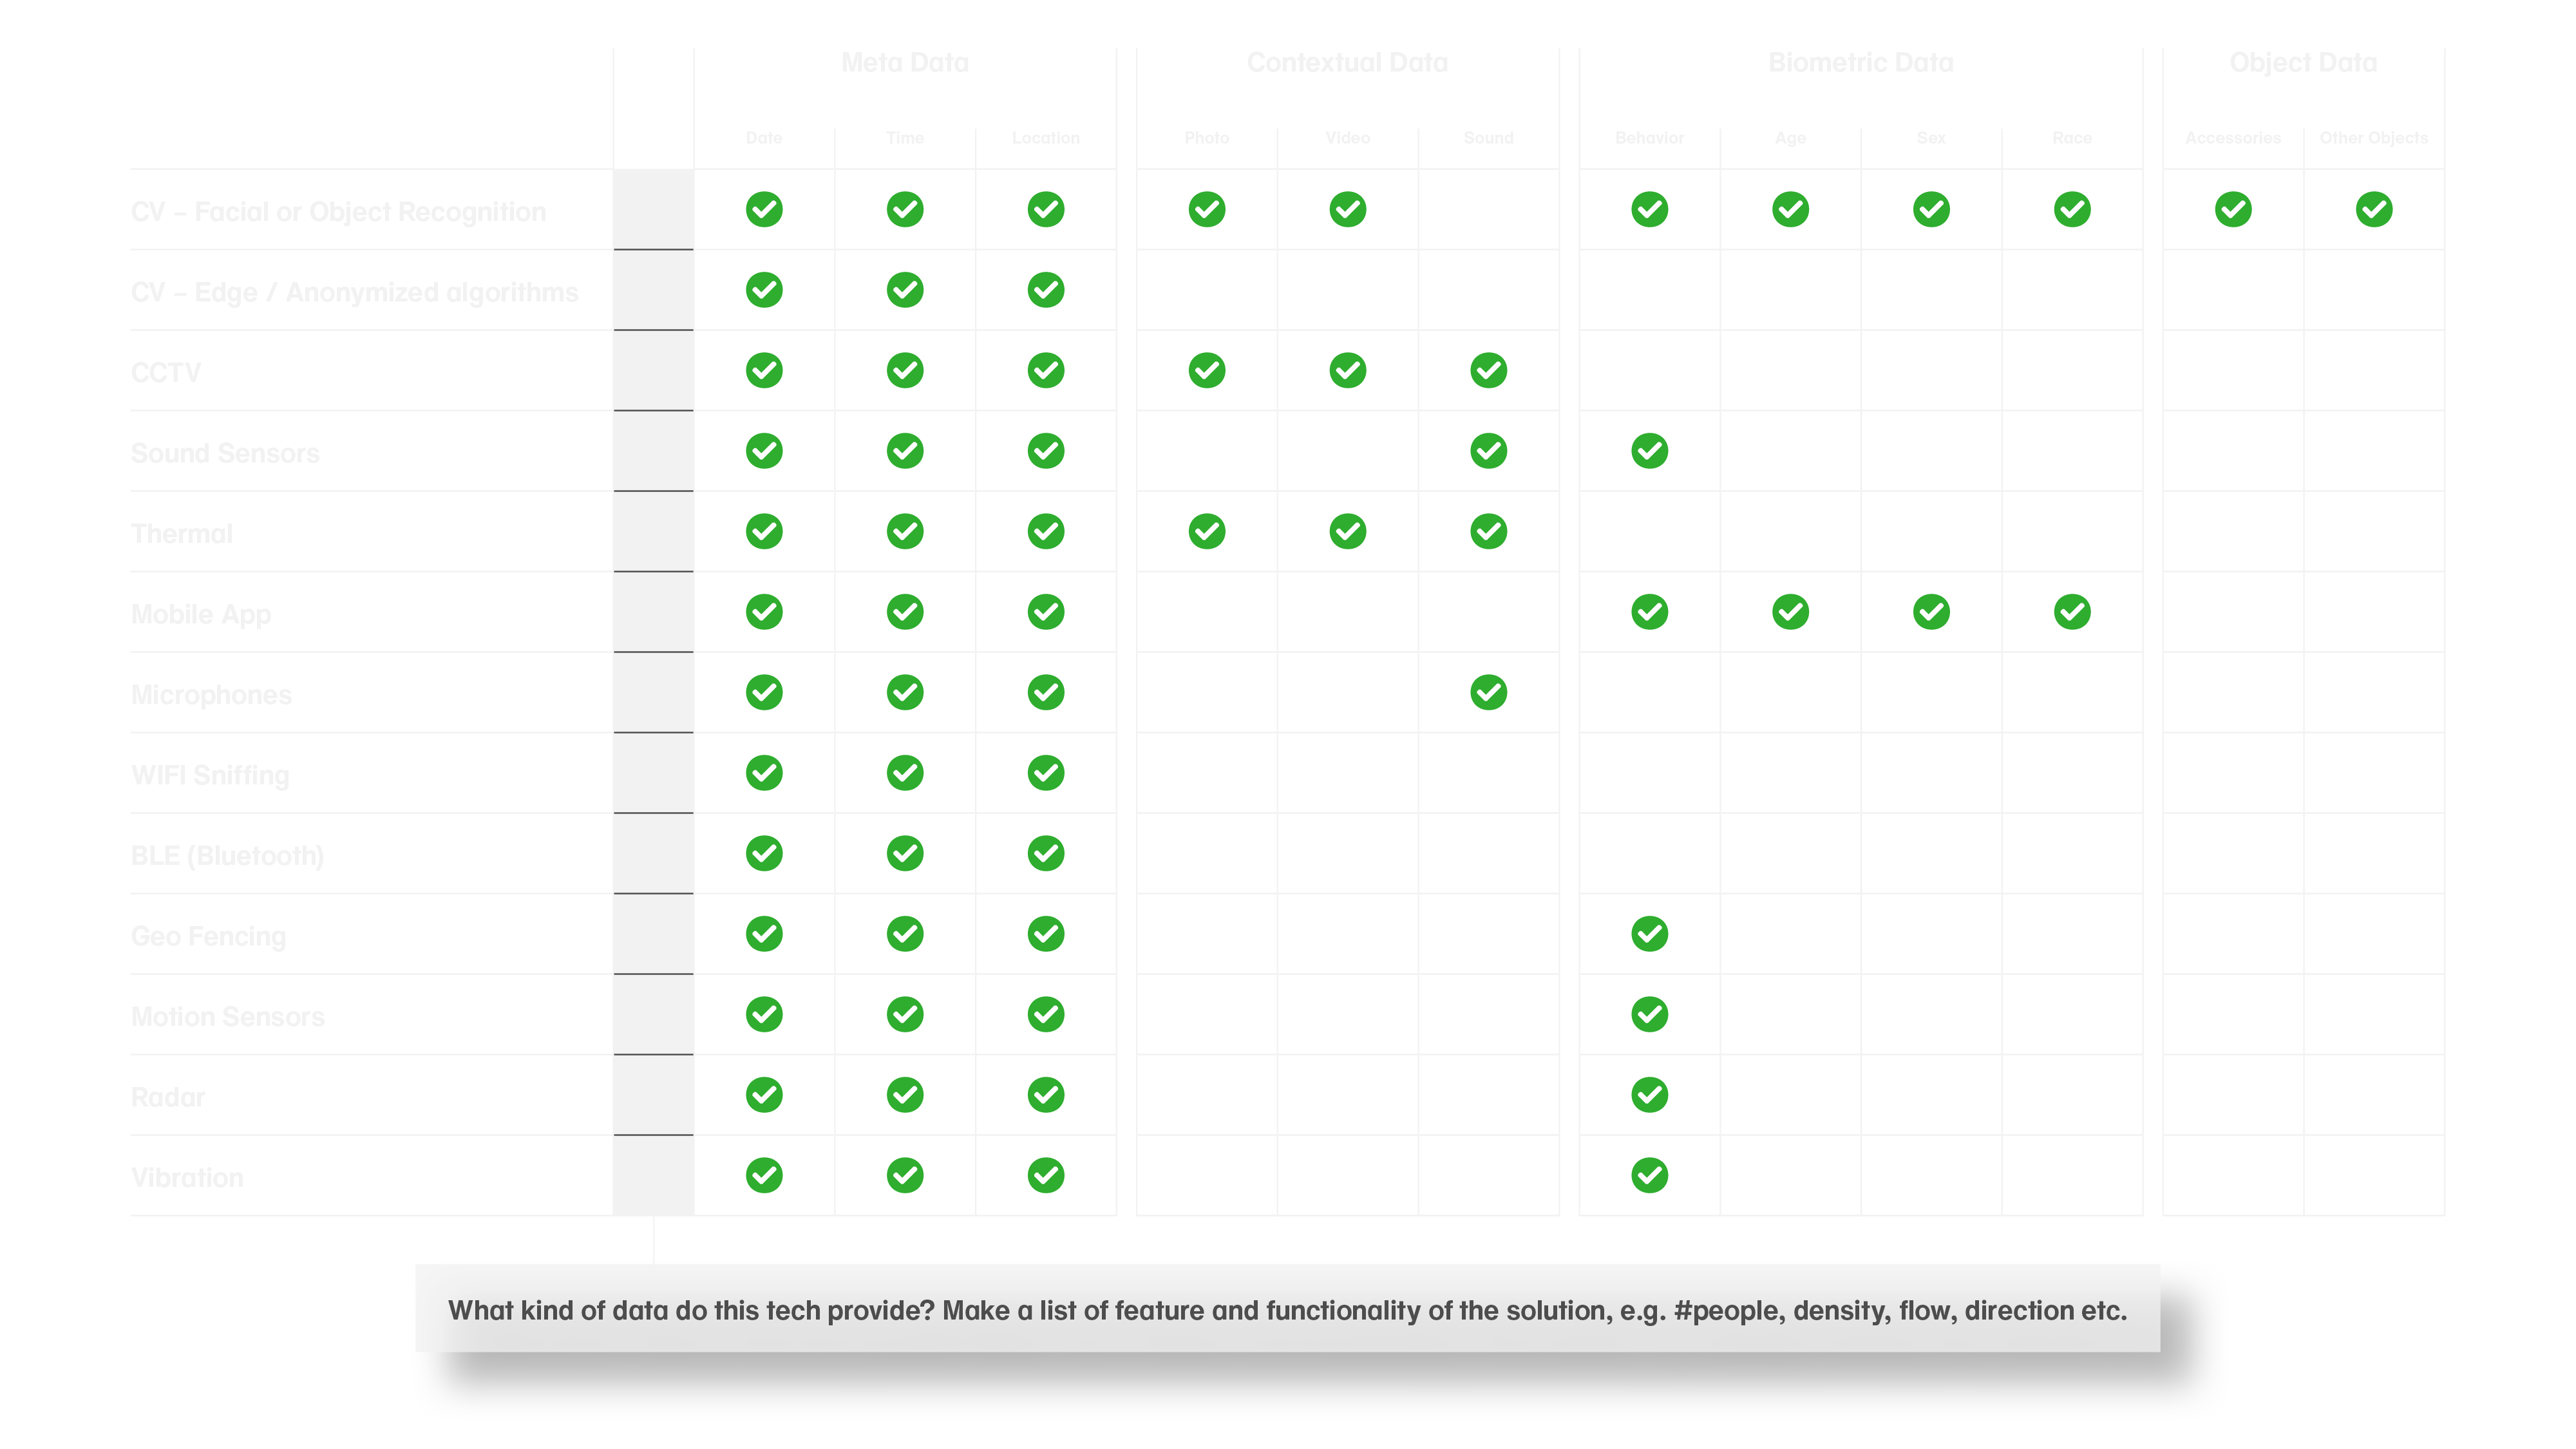
5.2.1 Invasiveness Matrix
The Invasiveness Matrix below shows the various kinds of data that different sensing technologies generate. This quick guide will tell you which solutions will create biometric data versus anonymous data, location data and more.
5.2.2 Types of Sensors and Visualisations
Different types of sensors collect different types of data. Take your time to understand these (sometimes subtle) differences so you can better understand how to process that data so you can achieve your goals. Without going into too much technical detail, we have written up some basics about three specific types of sensors that provide valuable data driven insights more than just object detection. These examples show that the processing technology behind a sensor makes for a big difference to the value and invasiveness of the data.
For a more generic overview of sensors you can revisit section 3.2 Technical choices.
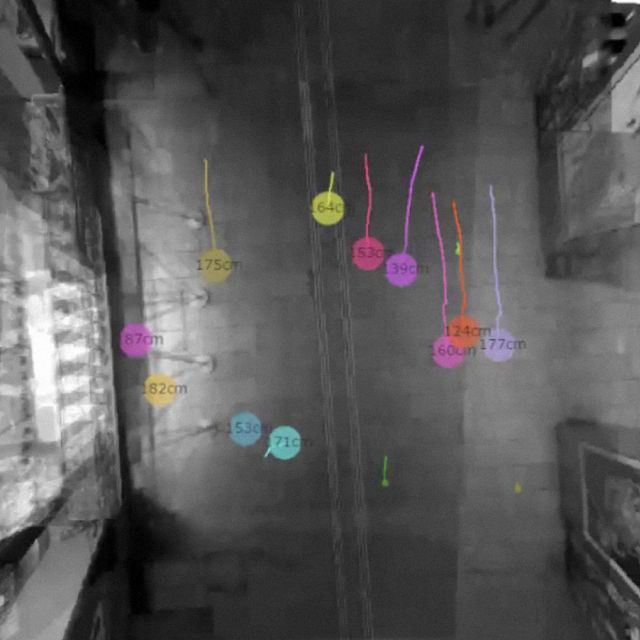
3D Sensor
A depth sensing technology that uses three different techniques to detect and image map objects: stereoscopic vision, structured light pattern, or time of flight (ToF). All capture or produce 3D images which are anonymous and trackable in crowded spaces with a high level of accuracy. In the data visualisation, we can monitor anonymous objects (people) that can be given colors, shapes and ID’s.
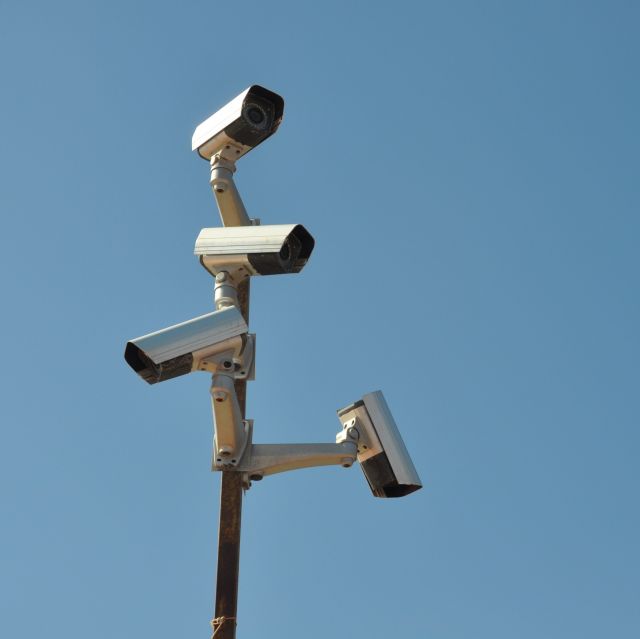
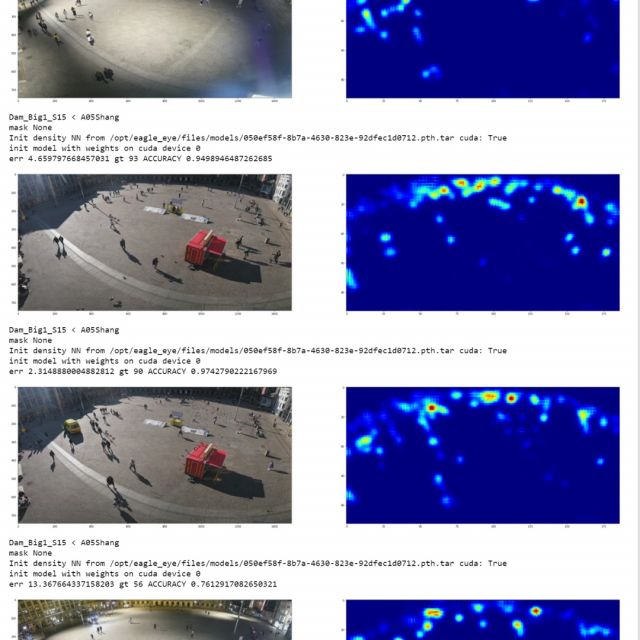
IP Cameras and Computer Vision
When they’re trained on enough samples, current computer vision systems do a good job at classifying images and localizing most objects in photos from video footage but it takes a lot of work to achieve a high level of accuracy. Computer vision applications include facial and object recognition, also biometrics which can be very invasive. In the Amsterdam example, here we are visualising density as an object cluster to help developers and teams to quickly validate the accuracy of their prediction model.
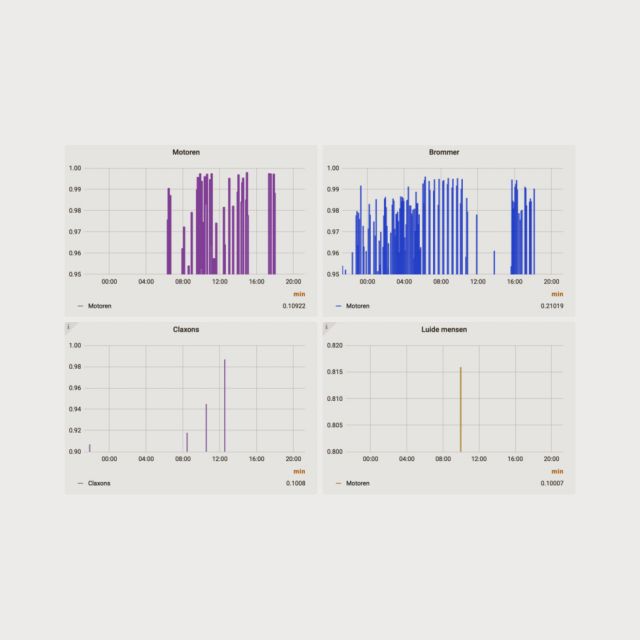
Sound Sensors and Pattern Recognition
These can be highly accurate and measure volume (dbl), tone, pitch, and/or frequency, or simply detect the existence sound above a certain threshold. They all use microphones but not all deliver insights related to the nature of sound or sound identification which is enabled by using existing libraries or training with machine learning. Typically noise levels are recorded in public spaces and visualised with a graph in a dashboard.
For more information about all the different sorts of sensors being used in several projects in Amsterdam to create data visualisations, download the Crowd Monitoring Systems Amsterdam (CMSA) project report.pdf.
5.2.3 Data Processing
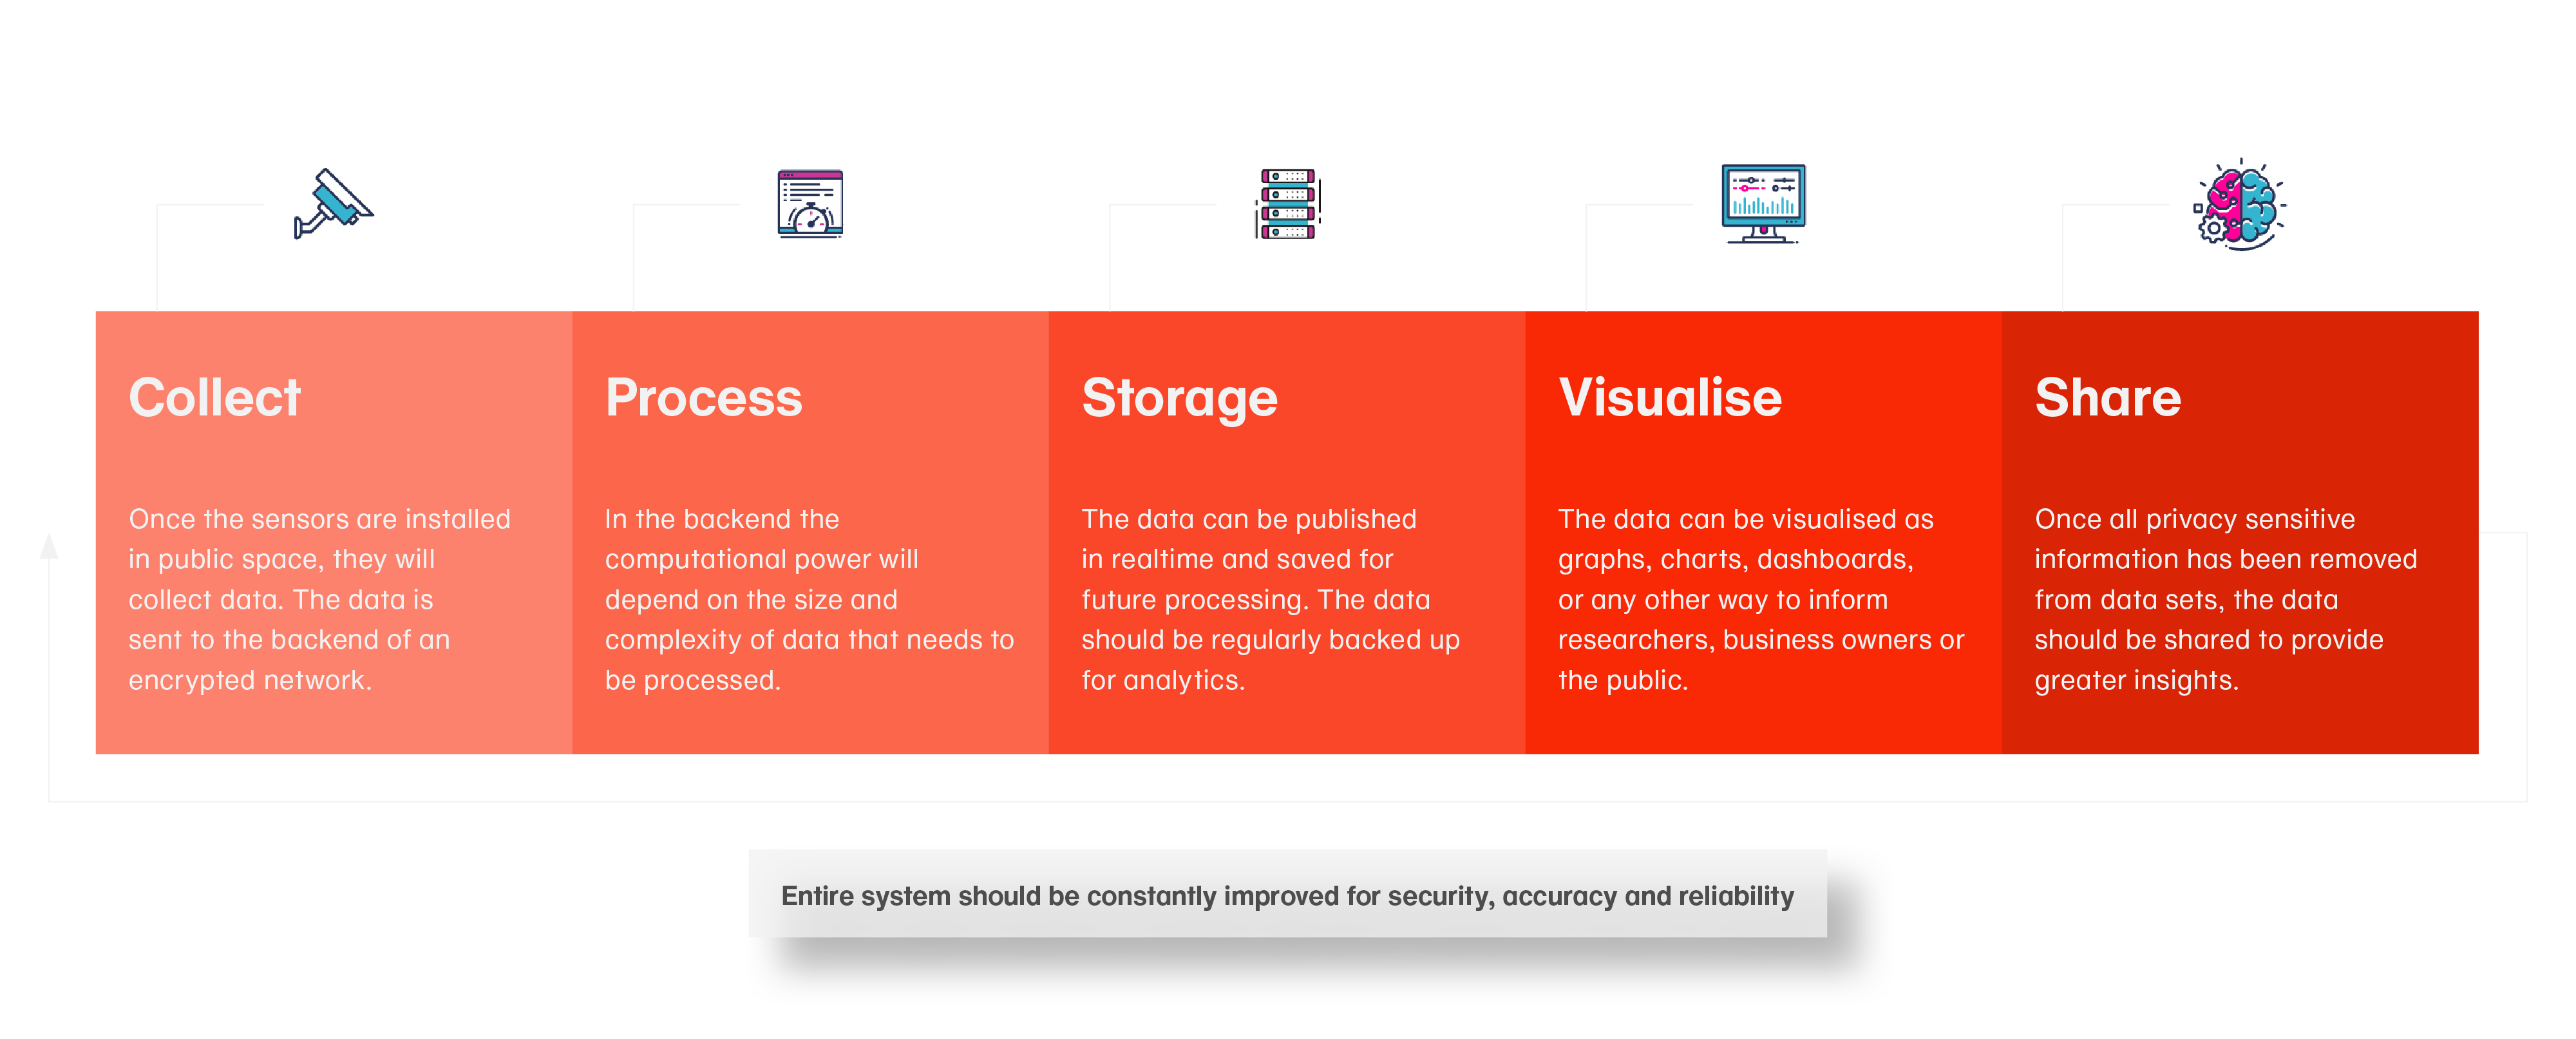
When you are sensing the city, you want to do it responsibly. You want to make sure that your devices are collecting data accurately and safely. You will need to use ISO standards (Dutch) and make sure you are GDPR compliant. Why you are gathering data in public spaces and what you are doing with it is more than collecting, processing, and storing but also visualising and sharing so it will be used to inform decisions and to create impact for the public good.
5.2.4 Data Architecture
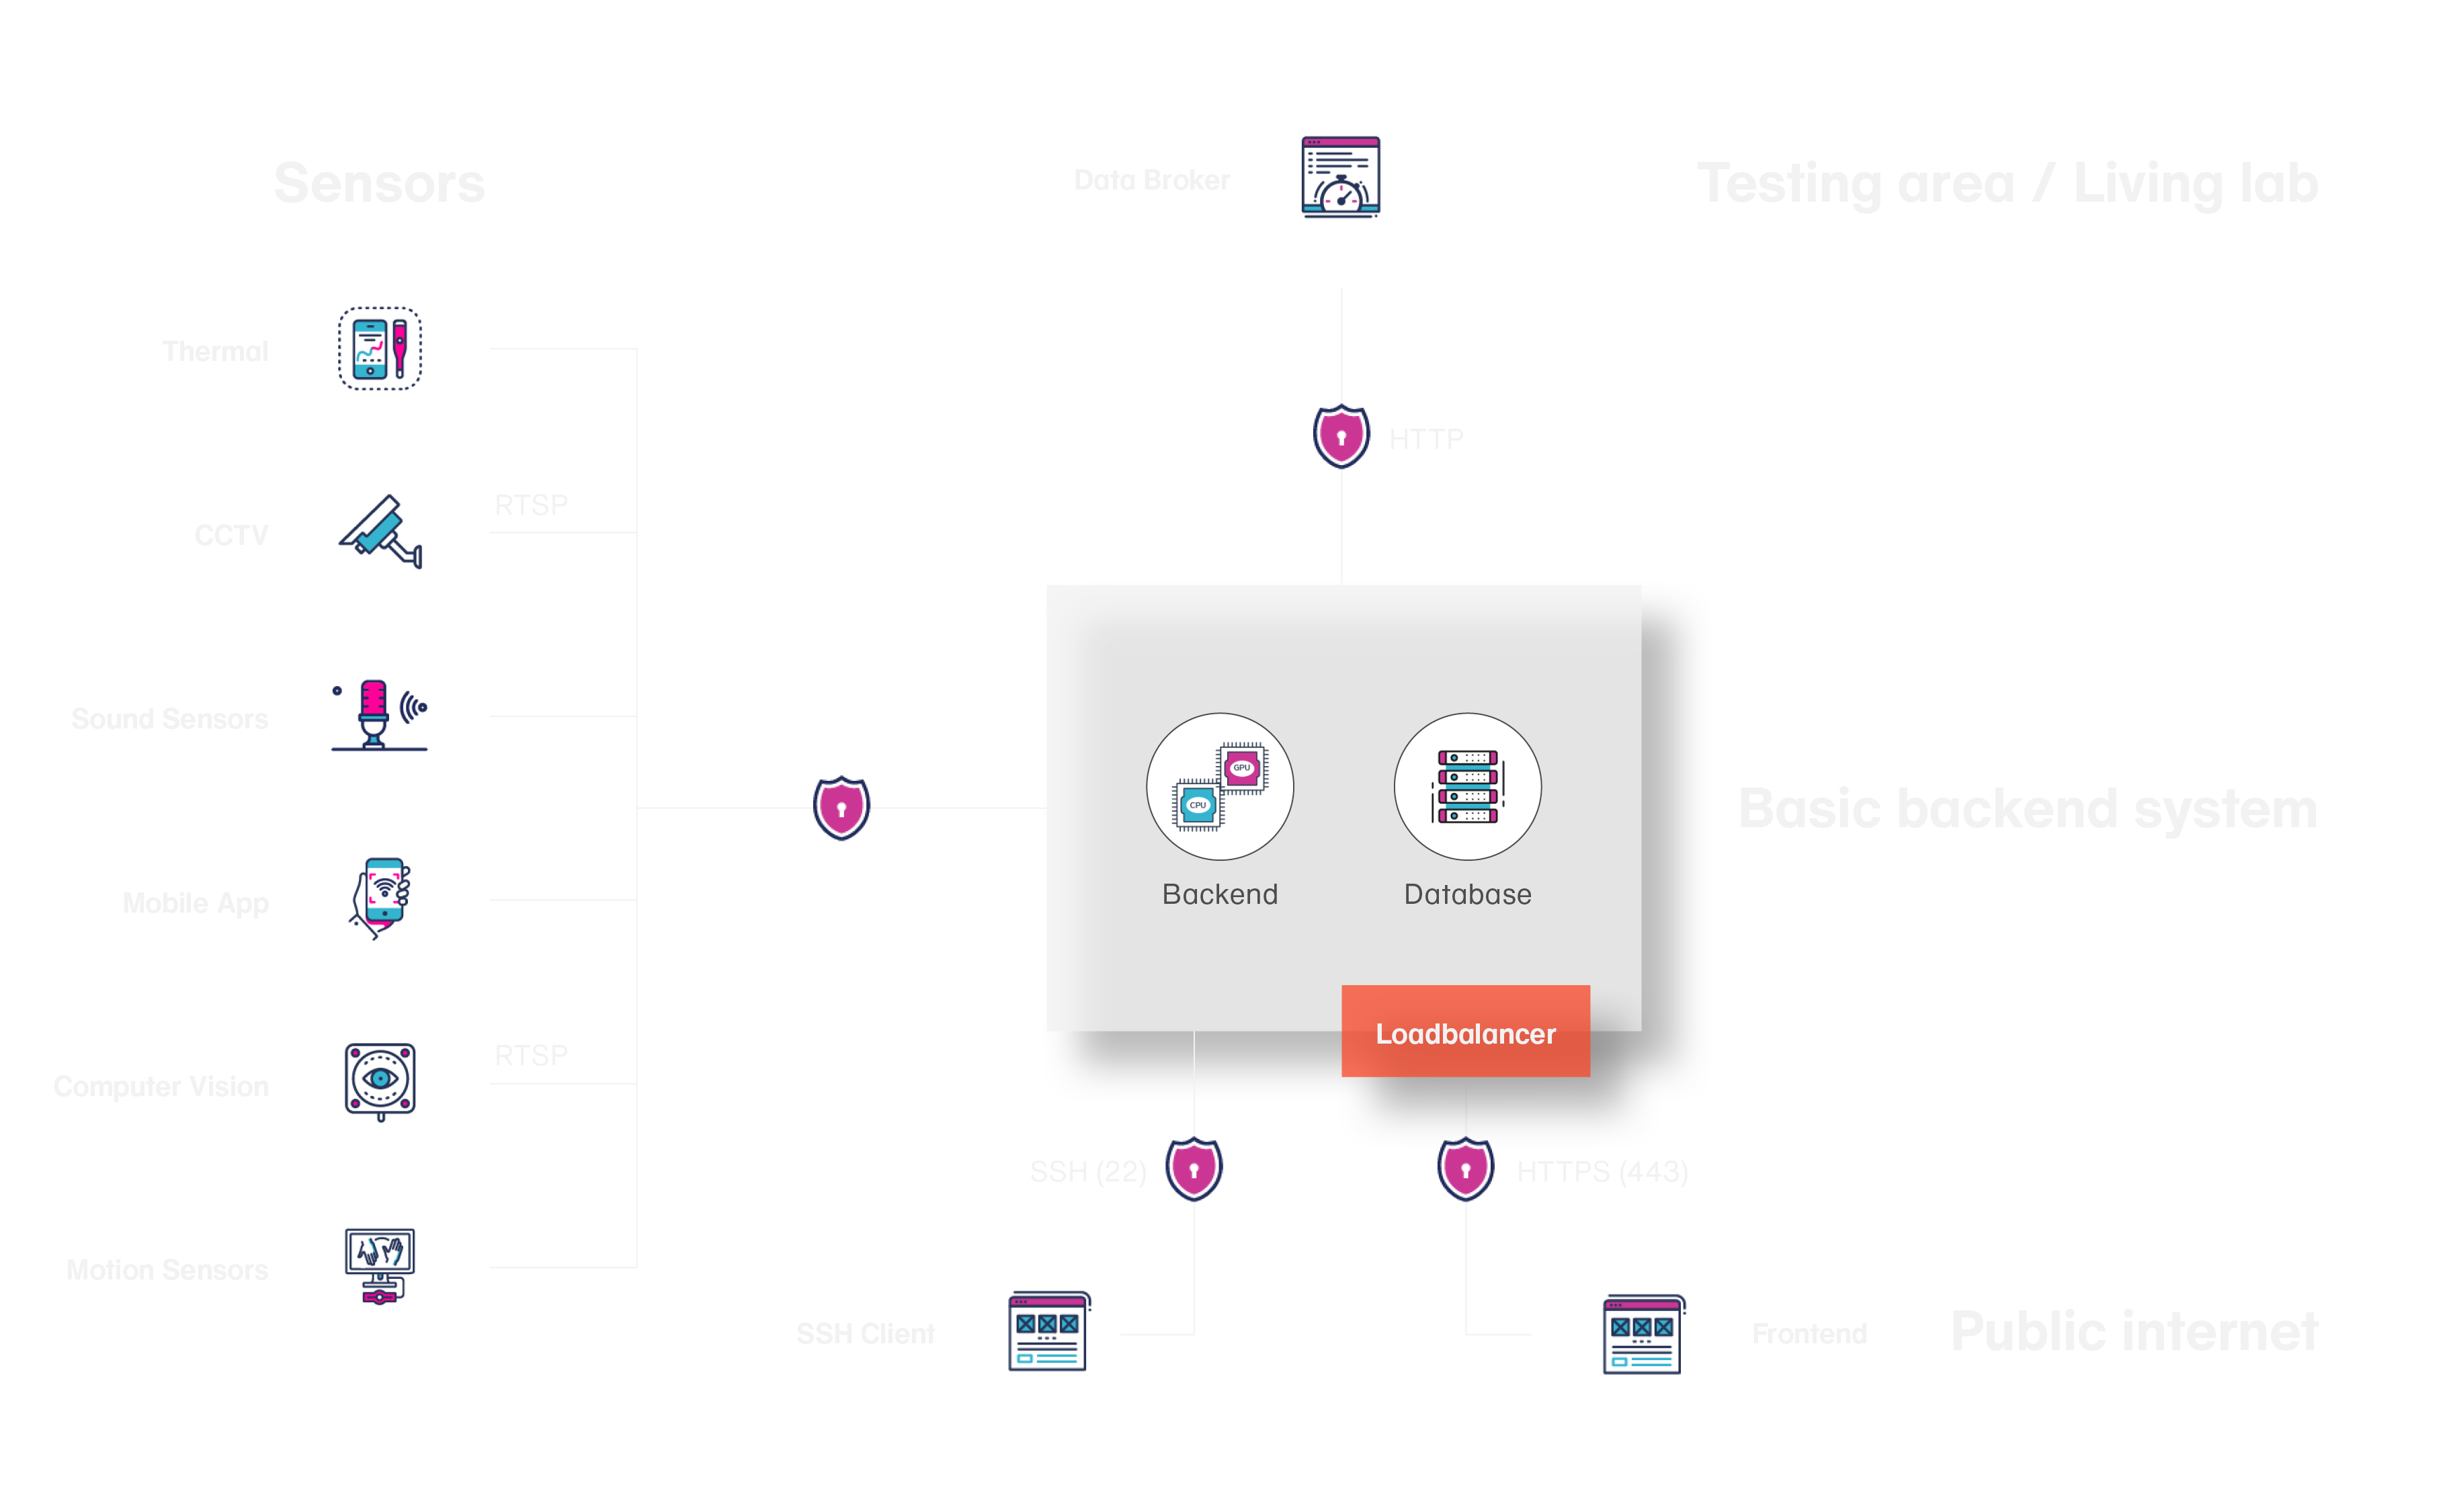
The schematic below provides an example of a basic data architecture based on sensing to provide an overview of the different components and how they work together. The sensors that collect the data send it to a back-end where it is processed, stored and then parsed to different front-ends where they can be visualised and shared in this simple example.
Every new project requires a different architecture. Think about data protection and privacy when designing your architecture. Ask questions like: Who has acces to the data? Is the system vulnerable to hacking? Try to prepare for your worst case scenario.
The Crowd Monitoring System Amsterdam (CMSA) is a city wide program being implemented in Amsterdam to gain insight into crowd population and density in the city. The system aims to create harmonised data using various sensors that gives the city insights that help make the city safer and more enjoyable. The CMSA uses privacy by design principles and is a contributing partner to the Responsible Sensing Toolkit. The systems architecture is a good example of how several devices throughout the city contribute data to a central dashboard where public servants can act on that data.
Read the Privacy Statement (in Dutch) of the CMSA at the website of the City of Amsterdam.
5.2.5 When data becomes actionable
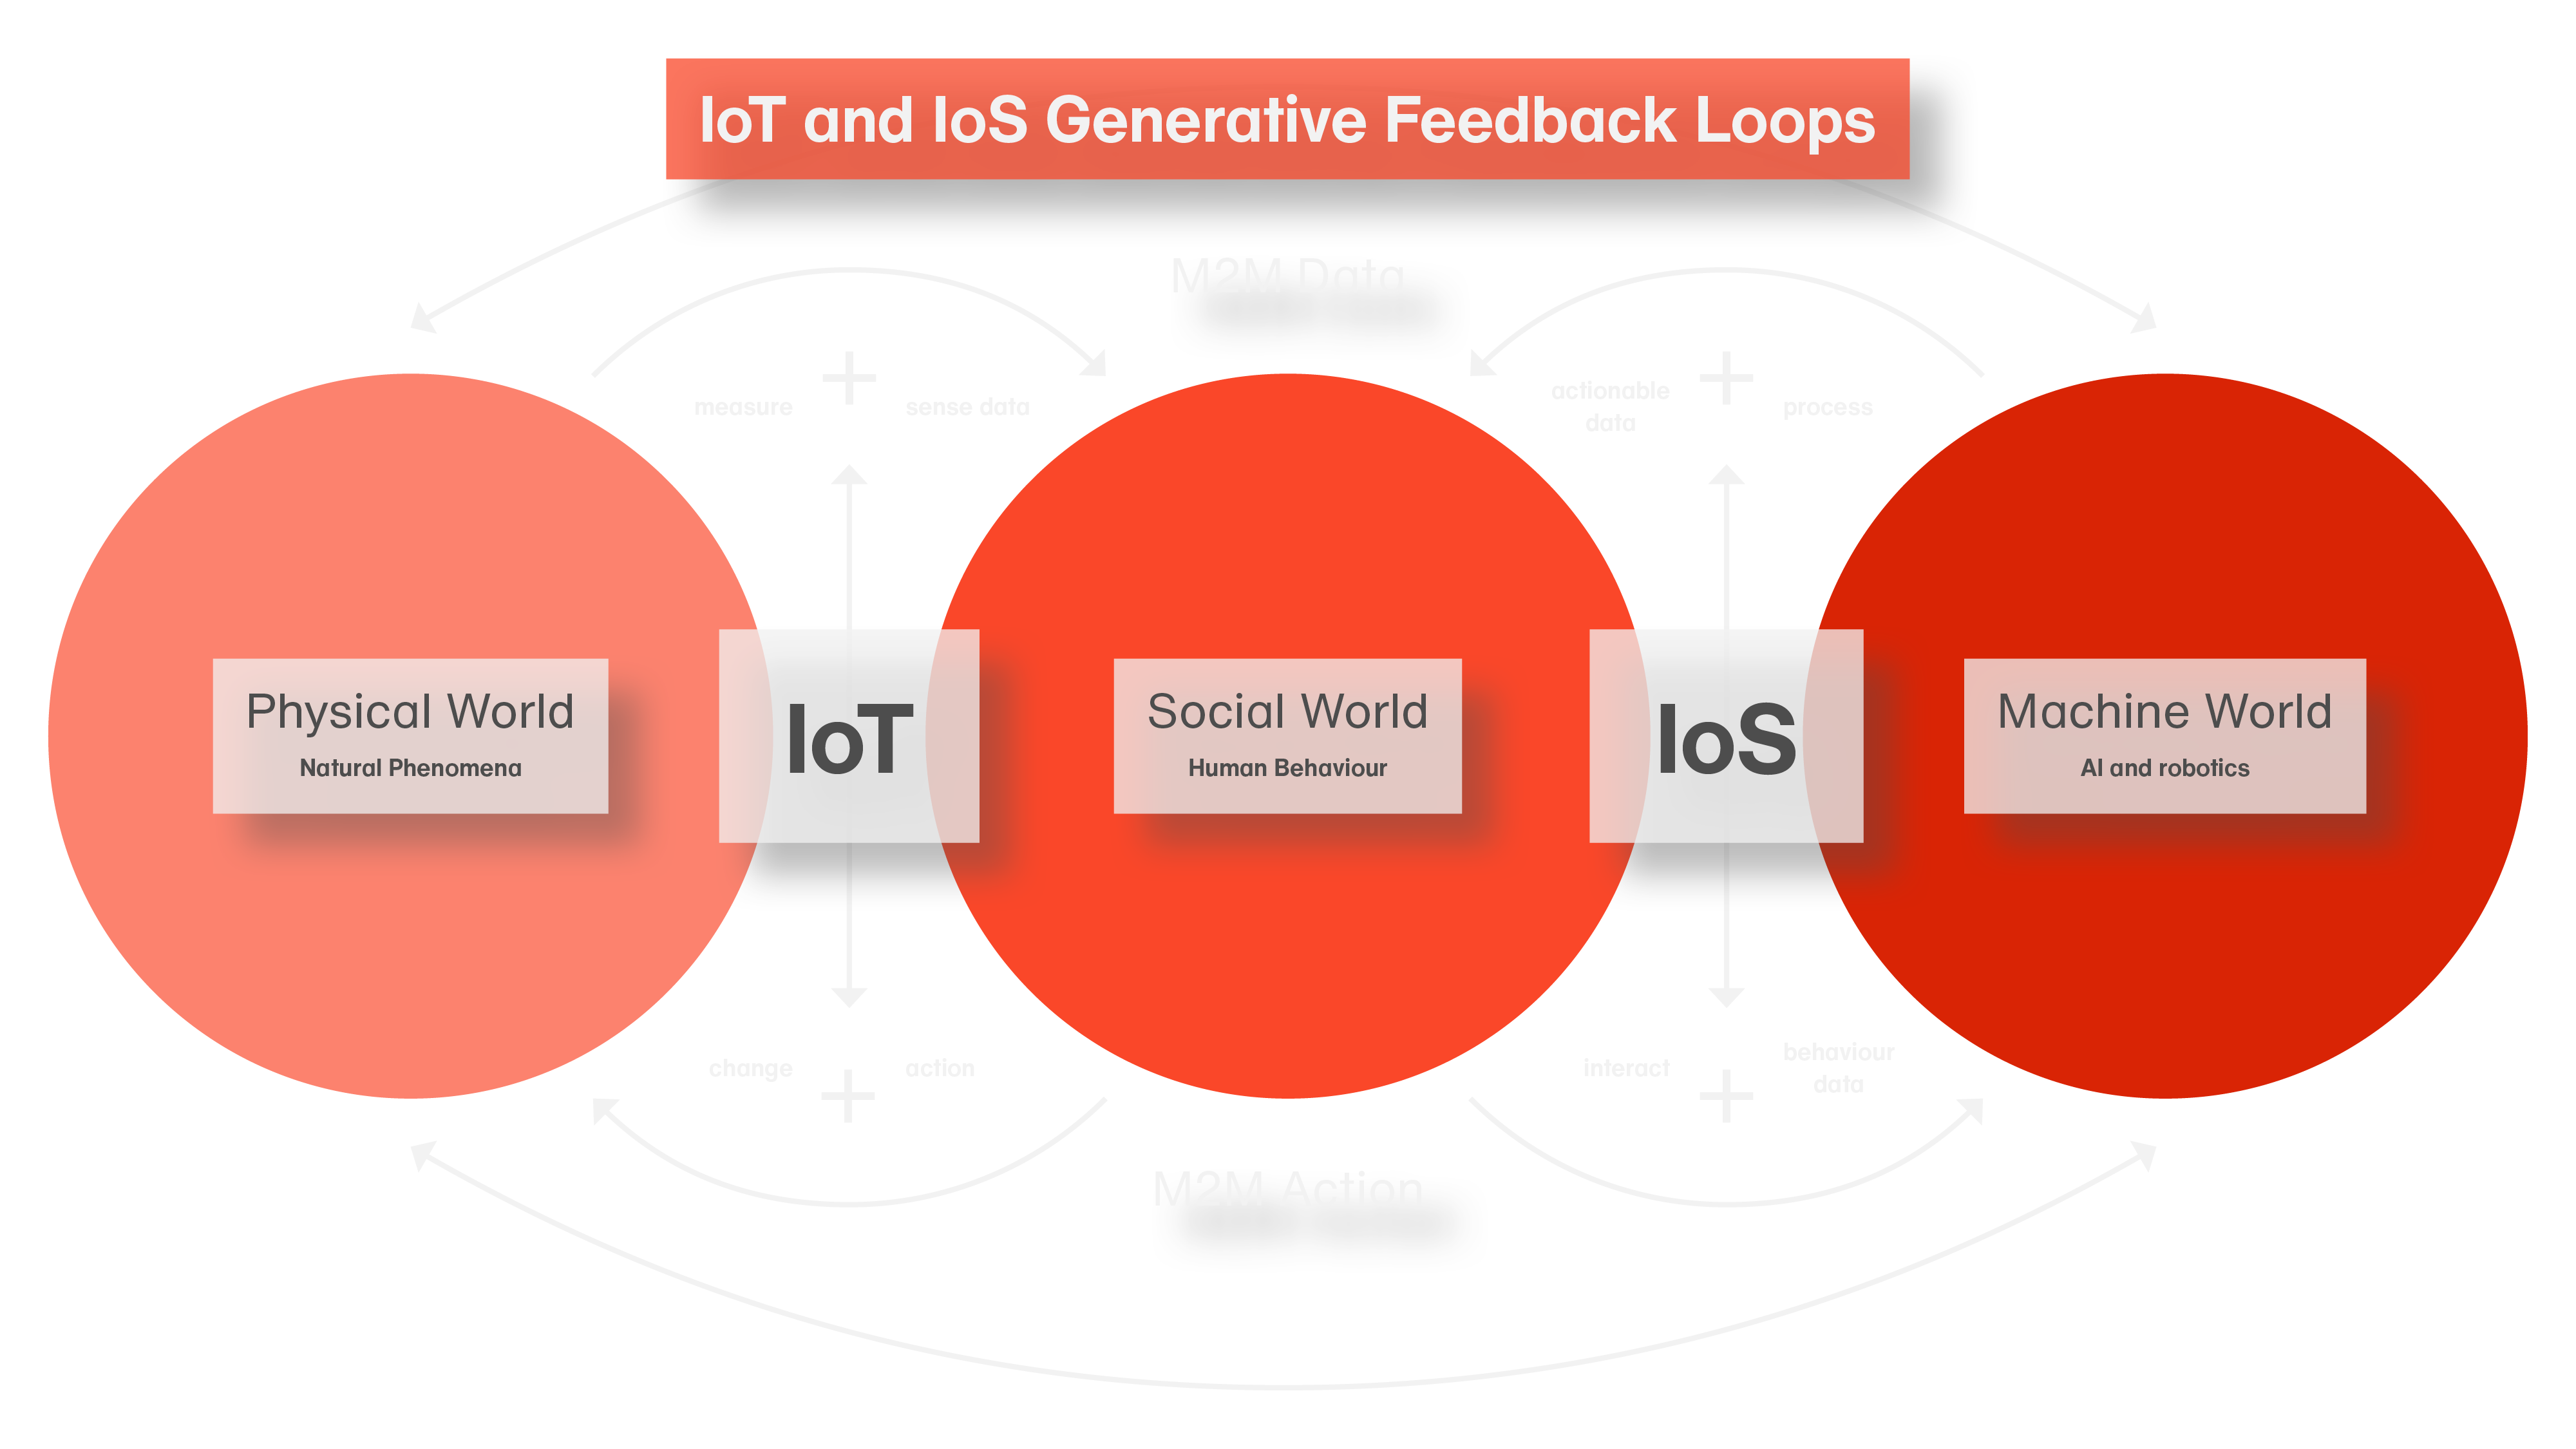
Generating data with sensors is one thing, what makes it valuable is when it can inform people at the right place and at the right time about how they can do something to affect a positive change and participate in platforms or interact with objects in such ways that influence their environment or their lives. These interactions also create and enrich data. We call these data, people and environment interactions feedback loops and this is when data becomes both actionable and valuable.
Internet of Things (IoT) devices measure phenomena in the physical world that become sense data which is sent to the the social world where humans can interact with that data in the Internet of Services (IoS) platforms. These interactions create behavioural data that become insights and enable actionable data that can effect changes in the physical world. Machine to Machine (M2M) interactivity also contributes to this continuous feedback loop of data value generation.
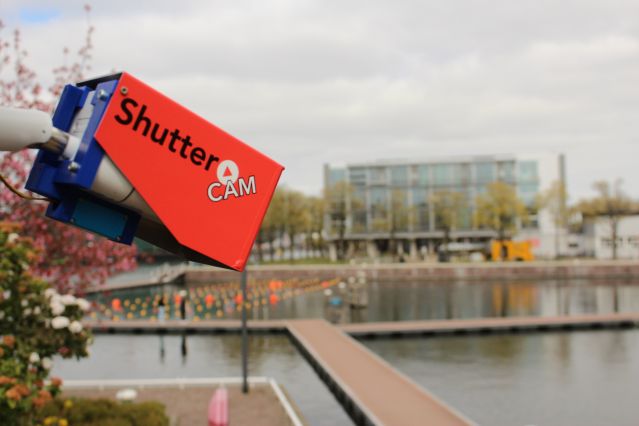
An example of an interactive feedback loop using sensors in public spaces would be the Shuttercam project that gives citizens the ability to “shut” a video camera in a park when they want privacy. Another example is a camera alerting people that they may be too close (less then the recommended safe distance of 1.5 meters) in pubic space. These and other examples are documented in detail in the sections below.
5.2.6 Data Visualisation
Perhaps the most significant way to create impact with the data you are collecting in public spaces is to use visualisations to tell the story of that data and give it meaning so it can be used to improve your city. You want the stakeholders to gain valuable insights that will inform better decisions and designs, but you also want the public to be able to see what their data means and understand how it is being used to their benefit. Below are some examples.
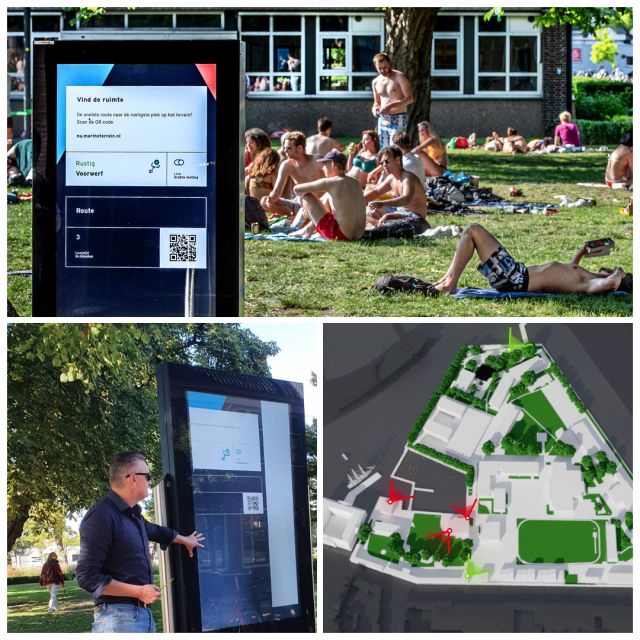
Smart Signs
A public information kiosk can use real-time data on 3D maps or display a simple traffic light design that indicates crowd density so people can make informed decisions in a busy park for instance. This specific example is being tested in Amsterdam at the Marineterrein Living Lab.
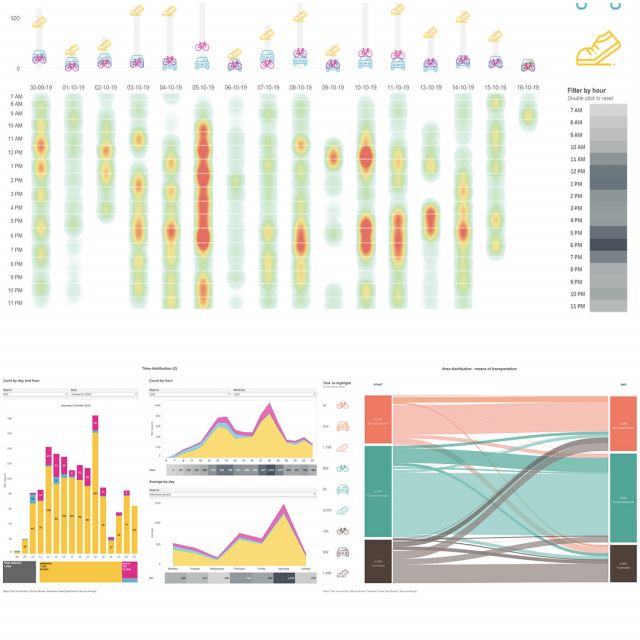
Dashboards
There are many different data visualisation tools like R, Tableau, or Grafana that can visualise data sets. You will need to work with data scientists as well as user interface designers to help tell the story of the data and make it clear how it can help make informed decisions. Here is an example of an interactive crowd monitoring dashboard in Amsterdam.
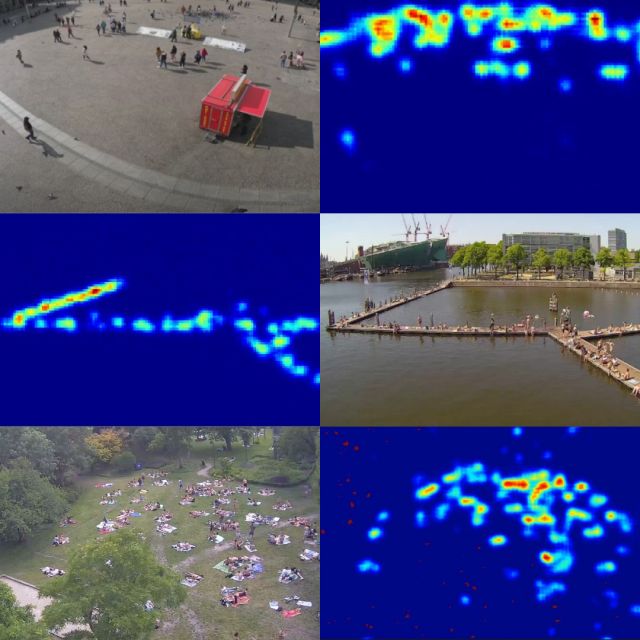
Density Maps
Also known as heat maps, this example looks like a thermal display but is actually detecting clusters of objects in a specific space. In this example the objects are people and the algorithm is created to count people and measure their proximity – the warmer the color the higher the density. This helps event organizers and police see concentrations of activity on a map and identify the location of potential “hotspots.”
5.2.7 Data and Public Interaction
Shuttercam project
How to know when a camera ‘sees’ you? The Shuttercam project was originated based on the notion that citizens currently can not directly know or see if and when cameras in public space are monitoring you or not. The project also questions the necessity for many non-security related cameras in the city to be switched on indefinitely.
For more information please visit the Shuttercam project page.
Future Fitness Garden
The COVID19 virus has not only been a threat to public health, but also to personal fitness. Members of sport-clubs have been forced outdoors as a safer alternative to normal studio workouts or trainings. What kind of safe outdoor facilities can we provide in public spaces for sport and wellness enthusiasts during the pandemic? In Amsterdam Tapp and the Marineterrien Living Lab created the Future Fitness Garden to measure and display the distance between people working out using sensors in a creative and interactive way.
For more information please visit the Tapp website.
Open Ears
Noise pollution is a big problem in the city. But to tackle it, you first need to know what exactly causes the noise. At the Marineterrein Amsterdam, tests are now being conducted with a sensor that can classify sounds and thus pinpoint the source. And this with technology that originated in the jungle to stop poachers.
For more information please visit the Sensing Clues website.
5.3 Video Library
The expert interviews are a quick way for you to get some great advice. Before moving on to Step 6: Measuring Impact, please take a few minutes to learn from personal experience and insights that will help you think about Data Collection and Processing for your sensing project.
All expert interviews ask these three questions:
What are the biggest challenges for monitoring in public spaces?
What are some approaches to address these challenges?
What advice can you give innovators thinking about deploying sensor technology?

Markus Pfundstein
Founder & Principle Engineer Life Electronic
Markus understands that data collection and processing takes place in context and tells us how important it is to be able to experiment in Living Labs to train data sets. A controlled environment is imperative to optimize algorithms efficiently but you also need to think about the end user and take the time to construct your solutions properly.
You have reached the second last step.
Responsible Sensing Toolkit Workshop Trial
As you can see this whole process is quite complex. Even as a municipal innovator with experience in sensing projects it can be difficult to implement these tools on your own.
If you need help, sign up for our Responsible Sensing Toolkit Workshop Trial. This workshop (Workshop 1) will help you and your team to identify your dilemmas with the Decision Canvas as a guide. The Workshop Trial takes only one hour and helps you to set up a clear roadmap to a responsible and ethical sensing project. In particular cases this workshop is free of charge.
Please check out our workshops or contact Sam Smits.