Alternative imaginaries for the smart city
From public values to urban sensors. An art- and design-led inquiry into urban imaginaries and urban technologies.
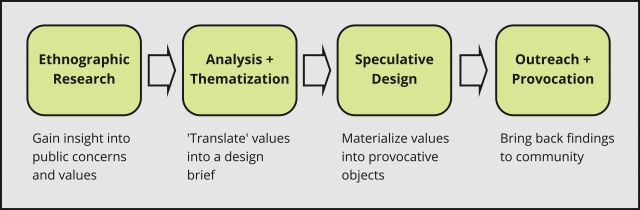
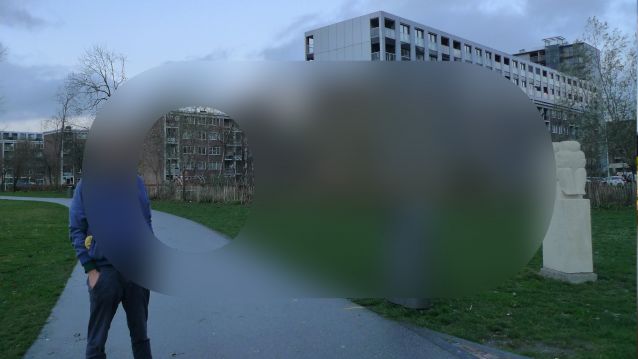
In this project we aim to explore what a smart city might look like starting not from the typical technocratic perspective, but from the perspective of the city's inhabitants. An ethnographer studied the community of Waterlandpleinbuurt in Amsterdam Noord over a period of several months, to find out about the local character of the neighbourhood and issues that exist in this community. Based on his experience of the area, artists and designers worked on conceptual, speculative designs for smart city dashboards and sensor systems fom the inhabitant's perspective.
This project has been commissioned by the Responsible Sensing Lab and is executed by TU Delft, under the guidance of Roy Bendor, assistant Professor in the Faculty of Industrial Design. It builds on an earlier iteration in Rotterdam. Read more about the Rotterdam project further down this page.
Our project approaches the smart city as an opportunity to pursue more democratic and equitable urban futures. By being attentive to urban imaginaries and the values, experiences and priorities they embody, we aim to imagine a city truly as smart as its citizens.”
— Roy Bendor, assistant Professor, Faculty of Industrial Design, TU Delft
The Amsterdam project
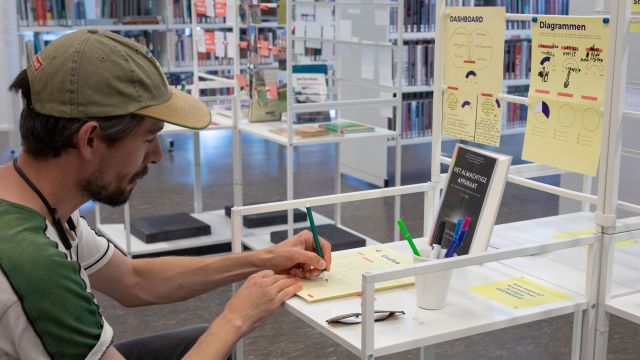
For the project in Amsterdam, eleven residents from all corners of the Waterlandplein neighbourhood went on a quest for desirable data in their neighbourhood. Desirable, as it was up to the residents to define which variables are important to measure, and how to recognize them.
Designer Tessa Steenkamp provided the residents with her design probes: a postal package with five small assignments, a map of the neighbourhood and several data collection templates. Going through the steps, residents could design what their urban data dashboard should look like.
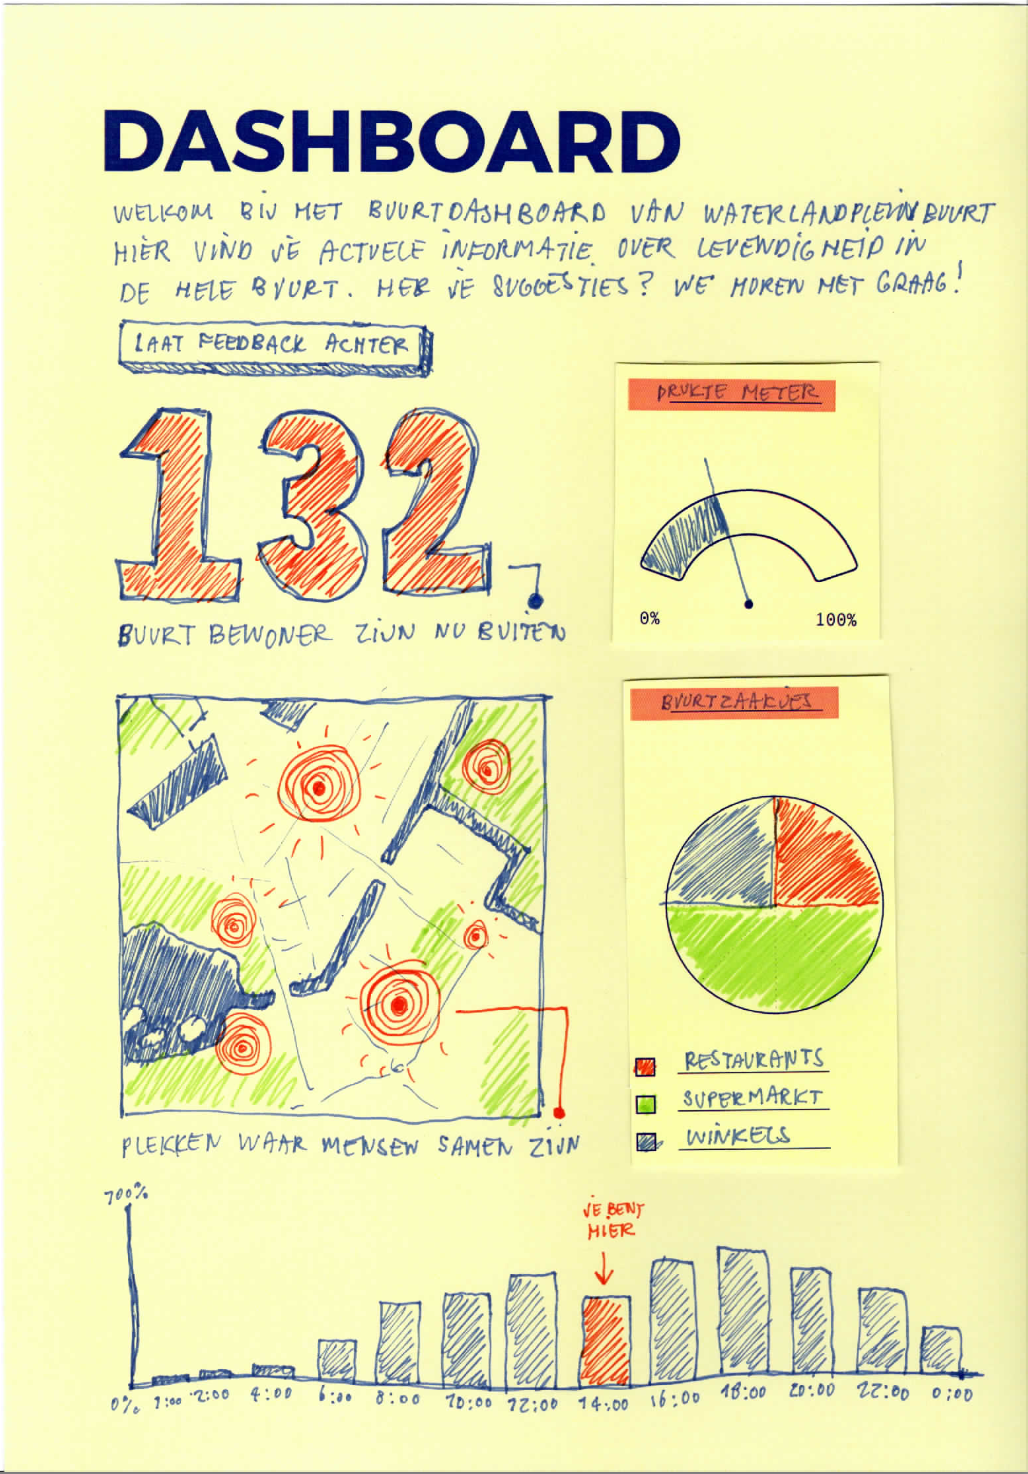
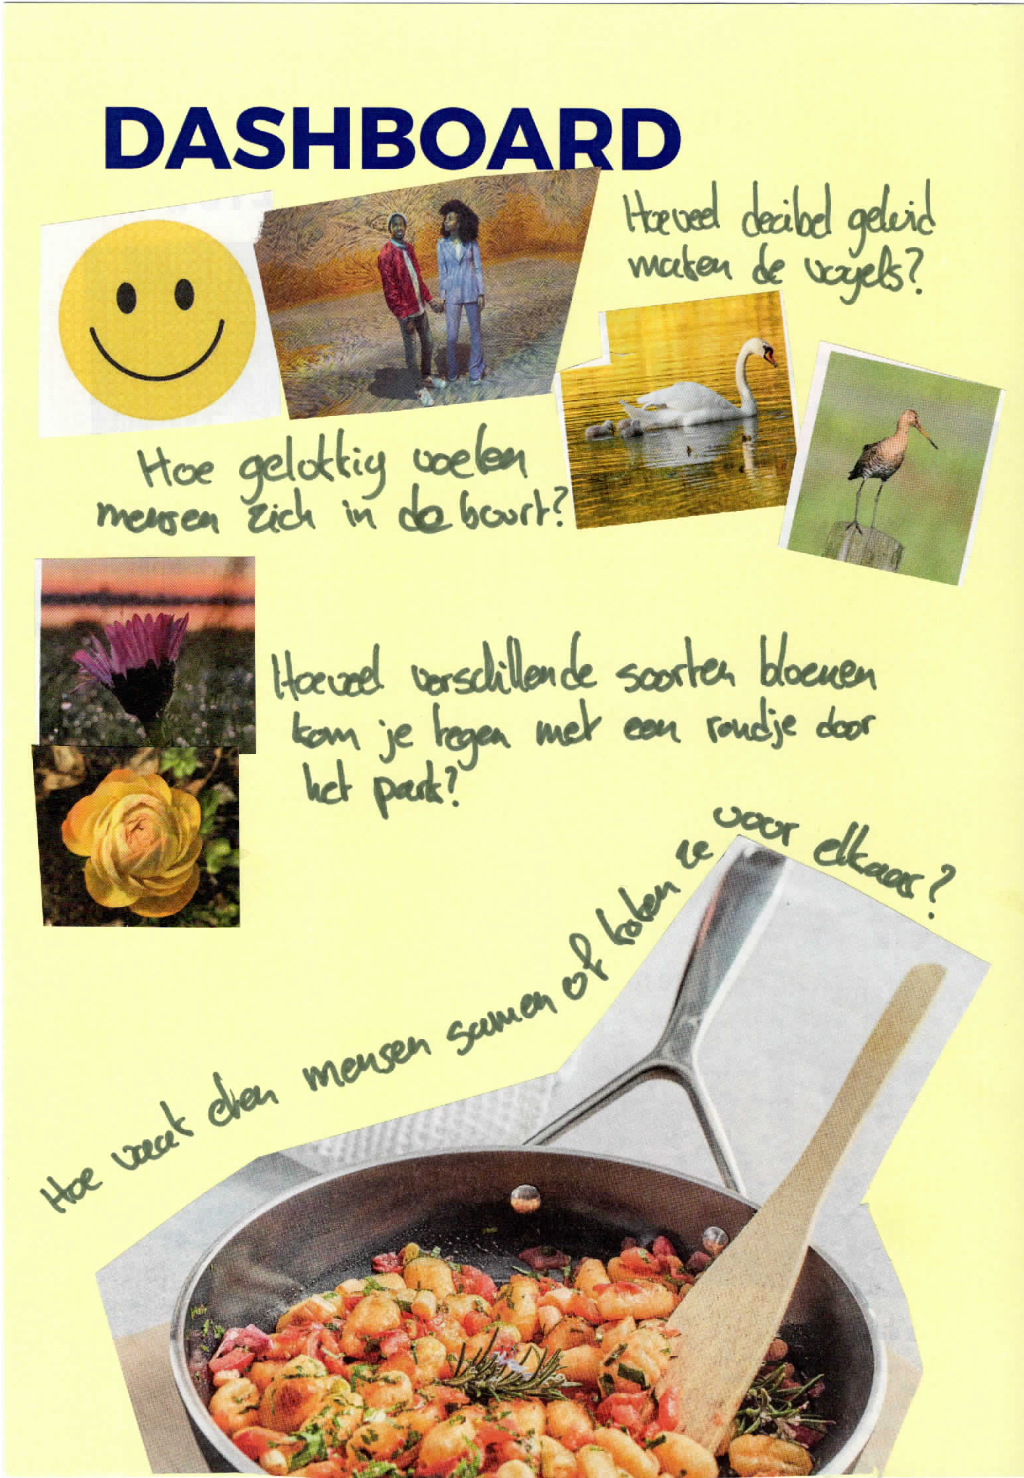
First the residents took photos of the most important things in the neighbourhood now, before drawing out how they would like to see the area’s future. In between is where data came in: getting to that future, how do you keep track of things changing for the better (or worse)? What do you see, and what does it tell you about progress?
The residents concluded in drawing their own dashboard. Building onto their collected data, they asked themselves: which measurements of the neighbourhood would I like to see in the morning, when I open my phone? What would this information mean to me?
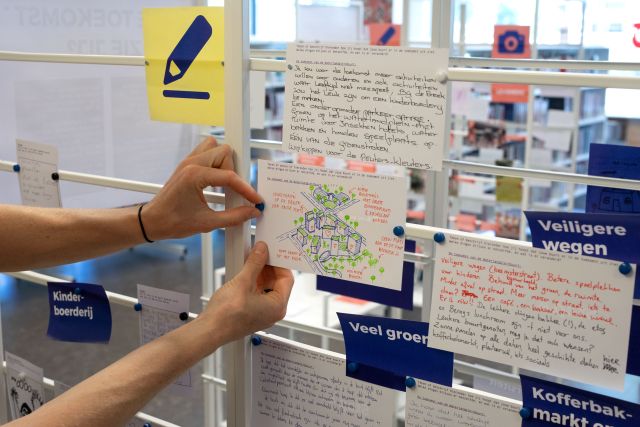
Local exhibition
All photos, maps and dashboards were brought together in an exhibition at the local library: OBA Waterlandplein. The exhibition invited the participants to reflect on each other’s input, and visitors to add their own dashboards and measurement ideas.
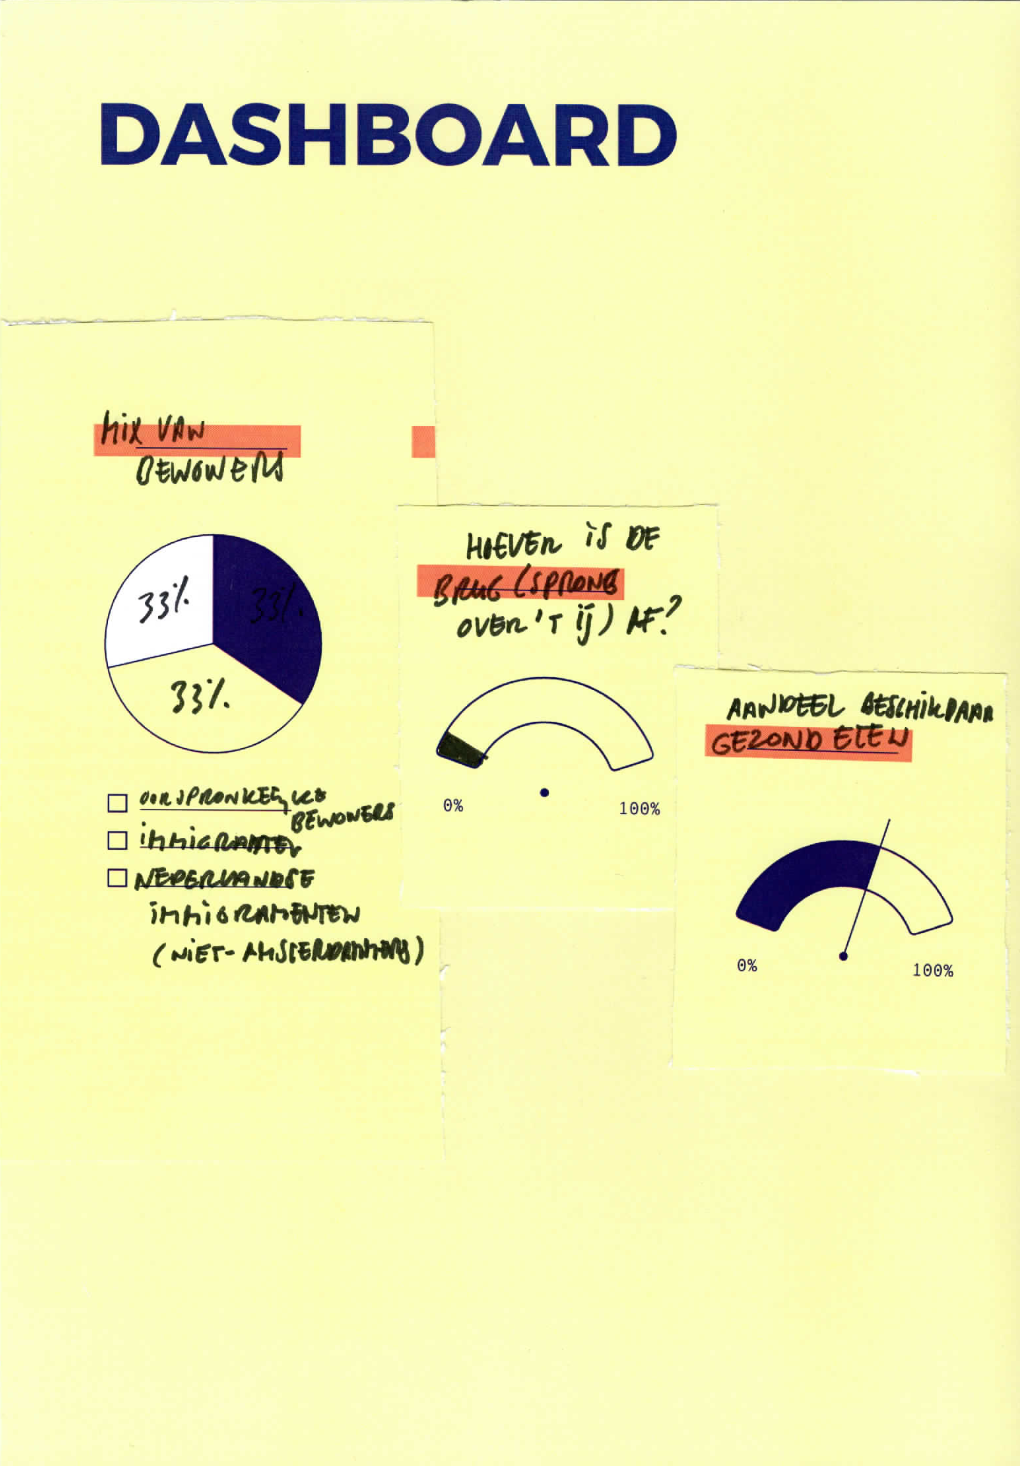
Seeing the collected data side by side, it was clear how much the residents care for their neighbourhood. In their dashboards they often wished for more of the good things rather than less of the bad. Without having existing policies or technologies in mind, they did not include common variables like loneliness or noise in their dashboards. Instead, they proposed to measure variables like the number of neighbours eating together, or the amount of people making music in the park.
The exhibition showed how urban data is rarely neutral. Thinking from the perspective of sensing technologies, one could measure sound levels. But whether that sound is experienced as noise or as an expression of liveliness in the neighbourhood, is a matter of interpretation. What could it mean for the neighbourhood, if we open up that process of interpretation?
The exhibition ‘Dashboard of the Neighbourhood: Waterlandplein’ was on show in the local public library (OBA Waterlandplein) from July 20th to Sep 2nd 2022.
The Rotterdam project
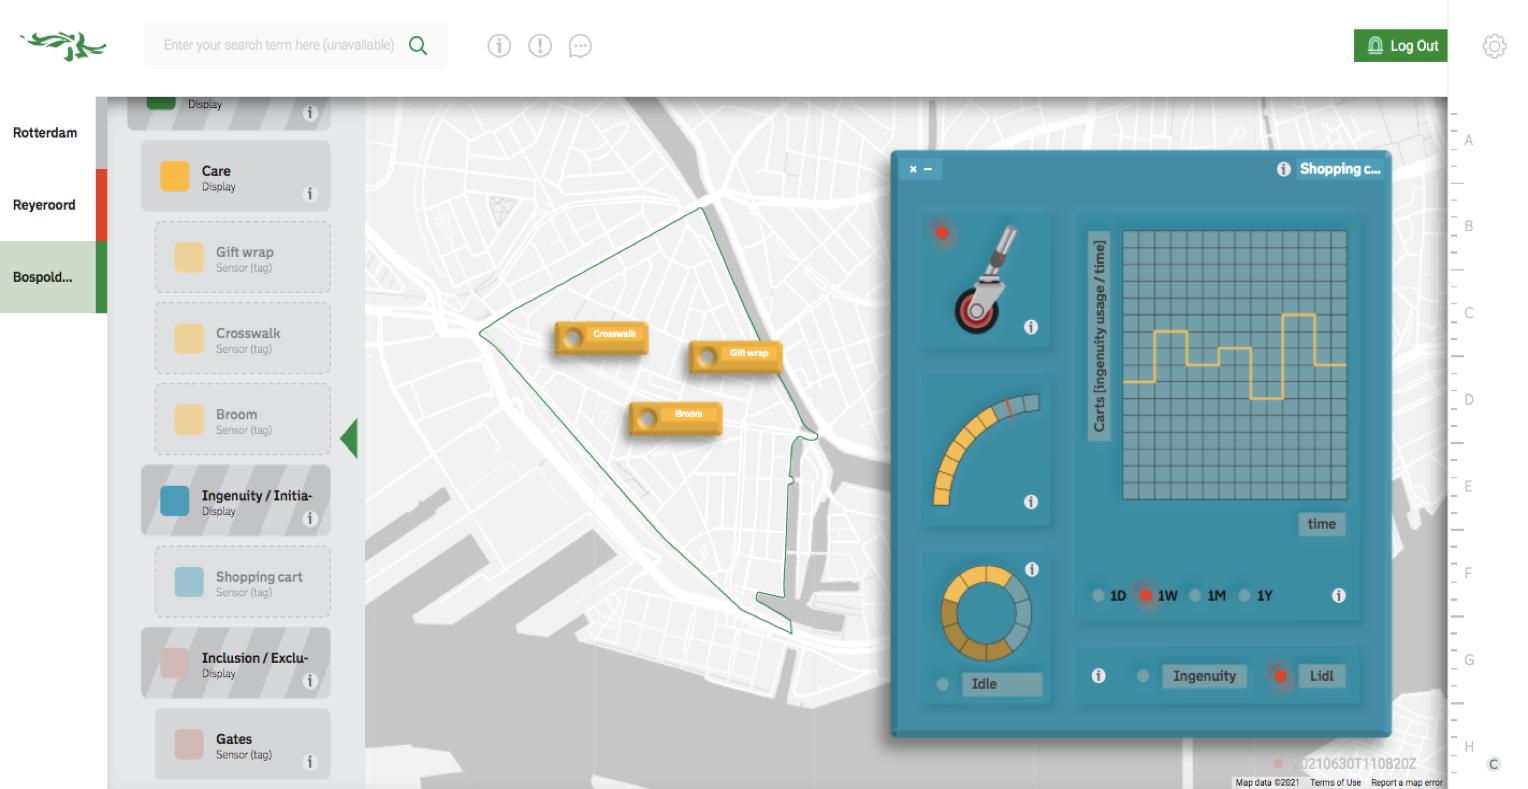
The Rotterdam iteration that preceded the Amsterdam project was done in collaboration with Richard Vijgen, V2_Lab for the Unstable Media, and the City of Rotterdam.
As part of the project in Rotterdam, designer Peter Kalkman developed a speculative dashboard for two Rotterdam neighbourhoods. The dashboards indicate new, provocative ways to measure and display themes that emerged during research in the neighbourhoods: care, ingenuity, inclusion, outspokenness, trust, and boredom.
Read more about the previous Rotterdam project here: alternative-imaginaries.nl. Have a look at the speculative Rotterdam dashboard here.
Interview
We did an interview with the initiator of this project - assistant professor Roy Bendor - as well as the ethnographer doing field research in the Waterlandplein neighbourhood in Amsterdam. Read the interview here:
TU Delft
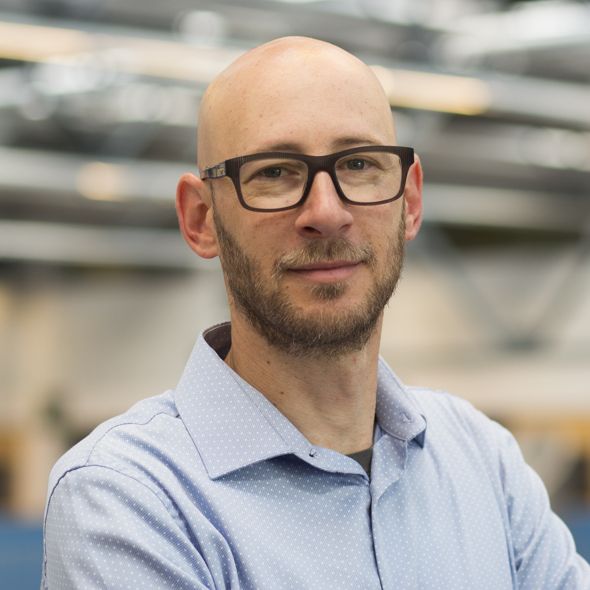
Roy Bendor
Assistant professor of Critical Design at the Faculty of Industrial Design Engineering, TU Delft
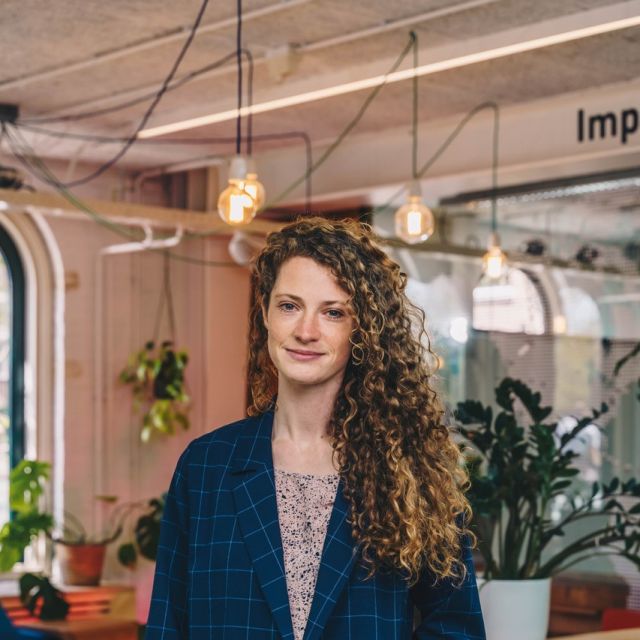
Tessa Steenkamp
Experience designer